Description
As soon as a student begins a quiz the attempt can be seen on the Results page. After grading, either automatic or manual, the results and an overview of performance can be viewed.
This Guide Will Help You to:
Filter the quiz results view
The quiz attempts page will allow an instructor to track student progress, grades, and reports.
-
Select the Title of the Quiz you would like to view
-
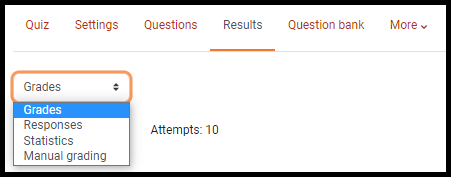
In the Activity Navigation menu, Select Results.
-
You can also Select the Attempts link.

-
In the What to include in the report section, Select the options to filter the report.
-
In the Attempts from drop-down menu, Select the information you would like included.
-
enrolled users who have attempted the quiz
-
enrolled users who have not attempted the quiz
-
enrolled users who have, or have not, attempted the quiz
-
all users who have attempted the quiz
-
In the Attempts that are, select the boxes to include any or all of the following attempts:
-
In progress
-
Overdue
-
Finished
-
Never submitted
-
In the Show only attempts that have been regraded/are marked as needing regrading, select the box if you would like to show only these attempts. This can be helpful if you are regrading.
[Note: To manually grade questions, see Quiz Activity: Manual Grading [Faculty]]

-
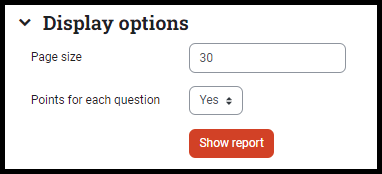
In the Display options section:
-
Select Show report after choosing your options

View quiz results
The default view of the results will present student results using the Grade information.

The table can be filtered using the First name and/or Last name letters.
Selecting Reset table preferences will erase the filters.

The table of students’ results can also be sorted by each column highest to lowest, or lowest to highest for numbers; or A-Z or Z-A for letters.
[Note: If multiple attempts are allowed the highlighted attempt will be the one showing in the gradebook.]

In the Grades drop-down menu, you can select Responses to display the student response instead of the points.


View the overall distribution of quiz results
Below the table you will see the Overall number of students achieving grade ranges.
The graph for the reports will show the graded score, the total points possible on the x- axis, and the number of students who received that score on the y-axis.
For information on how to download reports, See Quiz: Downloading Quiz Results [Faculty]
Seek Further Assistance
For additional assistance, please contact the ITRC at (208) 282-5880 or itrc@isu.edu
For more information, please visit Moodle.org: Quiz reports

This work was created by the Idaho State University Instructional Technology Resource Center and is licensed under a Creative Commons Attribution-NonCommercial 4.0 International License